Its a truly interdisciplinary team, including Mark Carnall and Jack Ashby from the Grant Museum, Steve Gray and Andy Hudson Smith from CASA, Susannah Chan and Sally MacDonald from UCL Museums and Public Engagement, and Claire Warwick and I from UCLDH. Well done team – and thank you all for your hard work, and for letting me join in the fun!
As well as the blog posts from the Grant Museum and Claire Ross, Andy Hudson-Smith has a good write up on his blog about the QRator team and the award – I dont think I can add much more than these three posts cover, except that I’m delighted!
Me, I got the temporary tattoos made up which we had fun baffling other attendees with. And drank some wine. And grinned into the wee small hours!
I also know nothing about how many times my other papers are downloaded from the websites of published journals, or consulted in print in the Library. The latter, no-one can really say about – but the former? It seems strange to me that we write articles (without being paid) and we get them published by people who make a profit on them, then we don’t even know – usually – how many downloads they are getting from the journals themselves.
That’s true enough, I thought. But whose fault is it that I don’t know about access statistics for journals I have published in? Heck, have I ever askedfor the access statistics for how many times my papers have been downloaded from the journals they are published in? Has anyone?
So, Reader, I asked for some facts and figures, regarding the circulation of journals, and the download statistics of my papers.
I have to say that the journals were really very helpful, and forthcoming, if surprised:
“I imagine the publishers would be happy to tell an author the cumulative downloads for their papers… So far as I know, you are the first author ever to ask… certainly the first to ask me.” said David Bawden, Editor of the Journal of Documentation. Jonas Söderholm, Editor of HumanIT, highlighted some of the issues journals will face if people start asking this kind of question, saying
“A reasonable request and we would gladly assist you. Unfortunately we do not have direct access to server logs as our web site is hosted as part of the larger University of Borås web. We will take your request as a good excuse to check into the matter though, and also review our general policy on log data.”
Most journals got back to me by return of email, telling me immediately what they knew (and being very aware of the limitations of their reporting mechanisms, for example whether or not the figures excluded robot activity, the fact that how long the user stays on the website is not known so accidental click-throughs are undetermined, etc. Such caveats were explained in detail). Emerald, the publishers of JDoc and Aslib Proceedings, were not comfortable in giving me access to wider statistics about their general readership numbers, given this could be commercially sensitive information, which is understandable: they were very happy to give me the statistics relating to my own papers, though.
The only journal not to get back to me was LLC , published by Oxford University Press (The editor replied to say he was not sure he had access to these statistics, but would ask). This is ironic, given I’m on the editorial board. I’ll press further, and take it to our summer steering-group meeting.
I suspect that the actual statistics involved are only really very interesting to myself. I had originally planned to make comparisons with the amount of downloads from UCL Discovery (Open Access (OA) is better, folks! etc) , but I think the picture is foggier than that. What this exercise does do is highlight the type of information that, as authors, we dont normally hear about, which can be actually quite interesting for us, as well as stressing the complex relationship between OA and paywalled publications. Here are some details:
One of my papers published in JDoc (Ross, C and Terras, M and Warwick, C and Welsh, A (2011) Enabled backchannel: conference Twitter use by digital humanists. J DOC, 67 (2) 214 – 237) was downloaded 804 times from the JDOC website during 2011, and was number 16 in the download popularity list that year. The total number of paper downloads from JDoc as a whole during that year was 123,228. Isn’t that interesting to know? I have a top 20 paper in a really good journal in my discipline! Who knew? It has now been downloaded 1114 times from their website. In comparison, there have been 531 total downloads of that paper from UCL Discovery in the past 6 months. But the time frame for comparison of downloads with the OA copy from Discovery isn’t the same, so comparing is problematic – and there are more downloads from the subscription journal than from our OA repository. Still, it shows a healthy amount of downloads, so I’m happy with that.
The Art Libraries Journal – only available in print, not online, were quick to tell me that the journal is distributed to 550 members: 200 going abroad to Libraries/Institutions, 150 sent to UK Personal members, and 200 going to UK Libraries/Institutions. My paper published there (Terras, M (2010) Should we just send a copy? Digitisation, Use and Usefulness. Art Libraries Journal, 35 (1)) has had 205 downloads in the last six months from UCL Discovery, so I perceive that as a really good additional advert for OA: the print circulation is fairly limited, but the OA copy is available to all who want it.
My paper in the International Journal of Digital Curation – itself an OA journal – (Gooding, P and Terras, M (2008) Grand Theft Archive: a quantitative analysis of the current state of computer game preservation. The International Journal of Digital Curation, 3 (2)) was downloaded 903 times in 2009 out of the 53,261 times the full text of a paper was accessed. (The average was 476, with standard deviation 307). In 2010 the paper accounted for 919 out of the 120,126 times the full text of a paper was accessed. (The average was 938, with standard deviation 1045.) That compares to only 85 downloads from the UCL repository, but hey, its freely available online anyway, without having to revert to an OA copy in an institutional repository. It might be worth drawing from this that copies of papers in institutional archives are only really used when the paper isnt available anywhere else, but you would hope that would be obvious, no?
InternetArchaeology journal has an online page with their download statistics readily available (how I wish all journals would do this). The journal gets around 6200 page requests per day. But since article size varies widely, with some split into 100s of separate HTML pages, it is difficult to know how meaningful this is. I was sent a spreadsheet of the stats from my paper published there (Terras, M (1999) A Virtual Tomb for Kelvingrove: Virtual Reality, Archaeology and Education. Internet Archaeology (7)) which suggests that there have been 2083 downloads of the PDF version of the paper from behind the paywall since 2001 (but some may be missing due to the way the reporting mechanism is set up) with none in the past year (compared to 276 downloads of this from UCL Discovery in the past six months, so many more from our institutional repository comparing like on like periods). The HTML version of the table of contents has been consulted 16, 282 times since 2001 (this is freely available to all comers) but there have been 67, 525 views of all files in the directory since then – but since the paper is comprised of hundreds of individual files, its difficult to ascertain readership. Judith Winters, the Editor of Internet Archaeology, notes “It is curious that when the journal went Open Access for about 2 weeks towards the end of last year, the counts did increase but not dramatically so” – so when a non-OA journal throws open its doors for a limited time (IA did this to mark open access week last year) its not like access figures go wild. That’s really interesting, in itself.
If you are still reading, then thanks. This stuff gets pretty turgid. But its been fascinating, for me, to see the (mostly positive) reactions publishers have to being approached about this – and surprising that not more people have actually asked publishers about these statistics. We are giving away our scholarship to publishers, in most cases: shouldn’t we get to know how it fares in the wide, wide world? As citation counts, and h-indexes, and “impact” become increasingly important to external funding councils and internal promotion procedures within universities, why would journal publishers not make this information available to authors? But why don’t they do it more routinely?
Will you need this type of information for the next grant proposal, or internal promotion, you chase? Why would you not be interested in how your research flies? But journal publishers will only start providing authors with this kind of information routinely if enough scholars start to ask about it, and it becomes part of the mechanics of publishing research – particularly when publishing research online.
So if you have published in a print journal which has an online presence, or in an online journal, drop them an email to ask politely how your downloads are going*. Do it. Do it now. Ask them. Ask them!
*Perhaps someone online can provide some input as to whether such a request comes under the rights of individuals in the Data Protection Act in the UK. If you are a named author on a journal article, does access statistics about that journal paper count as personal information? just a thought…
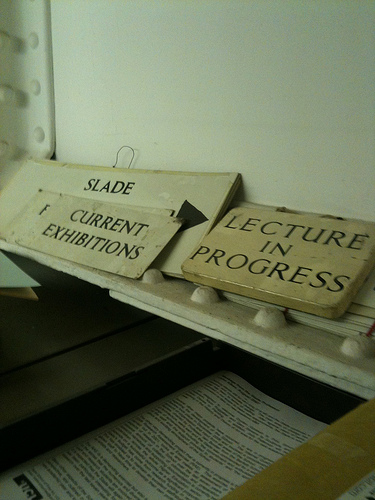
Treasures in the Slade School of Fine Art Archive, waiting to be looked at…
A few months ago I was invited to the Slade School of Fine Art at UCL, by the Head of Department, Professor Susan Collins, to have a poke about in their archive and a chat about what to do with it. Since 1871 the Slade School of Fine Art has educated and trained generations of world-renowned artists, from Gwen and Augustus John, Stanley Spencer and Ben Nicholson around the turn of the 20th century and early 1900’s, to Richard Hamilton and Eduardo Paolozzi in the 1940’s, through to Derek Jarman, Paula Rego, Euan Uglow and Craigie Aitchison in the 50’s and 60’s. More recent Turner Prize winning alumni include Martin Creed, Rachel Whiteread, Antony Gormley and Douglas Gordon. The Slade has an extensive archive on site which includes objects, papers, photographs, class lists, student records and artefacts dating throughout its history at UCL, which contains rich evidence of the time artists spent at the Slade. However, this archive is difficult to access, and no attempt has been made to present this rich information to a wider audience.
Until now. I’m really pleased to announce that UCLDH have received a UCL Small Research Grant to work with the Slade to undertake a pilot project with the Slade Archive – to see what is there, and how it can be exploited and used. One of the things we are going to do is dig up old class photographs, and try to identify people in them. We’re also going to be rummaging… and digitising… and plotting… and scheming… and posting things online… and…
The project starts in October, for only a few months, but I’m really looking forward to being involved. Dave Beavan, the UCLDH Research Manager, will also be on the case. You’ll hear more about this in the autumn!
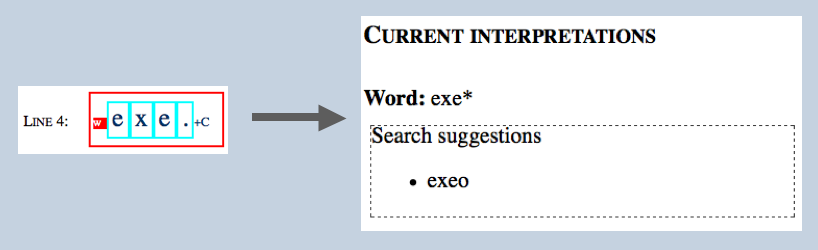
Henriette’s Interpretation Support System (ISS), which forms the basis of her thesis “Building an Interpretation Support System to aid the reading of Ancient Documents”.
Yesterday was a nail-biting day for me, as I headed over to Oxford to meet Henriette Roued-Cunliffe, one of my PhD students who I supervise with Professor Alan Bowman, to find out the outcome of her doctoral viva. (For those who dont know, the 3 or 4 year process of writing up a 100,000 word PhD, or D.Phil as they call it in Oxford, is examined by a face-to-face grilling with two examiners where you are expected to show you are a worthy intellectual combatant).
We had arranged to meet at 5pm (her viva started at 2pm) but there was no sign… 5.30 came and went… then the time edged towards 6… Doctoral vivas in Oxford are usually around 2 hours, so we started to get worried. But then Henriette arrived, slightly dazed but happy – the viva had started late due to one of the examiners being held up in traffic, and the examiners wanted to be thorough and let the viva take its course. But the strange thing about doctoral vivas in Oxford is that they are not allowed to tell you in the exam how you have done! So it wasn’t until all the paperwork was filed after that we got the news – around 7pm by now – that Henriette has passed with corrections (which is the best you can hope for!) Hurrah! Champagne all round!
You can read about Henriette’s doctoral work, “Building an Interpretation Support System to aid the reading of Ancient Documents”, here.
The aim is that the expert reading an ancient document should be able to use the ISS for the things which humans find difficult, which are things like:
Remembering complicated reasoning
Searching huge datasets
Accessing other experts knowledge
Enable cooperation between experts on a single document
Henriette demonstrates that this can be used to help experts search through different hypotheses and record the interpretation process of reading an Ancient text, whilst consulting and reusing existing information sources from other projects.
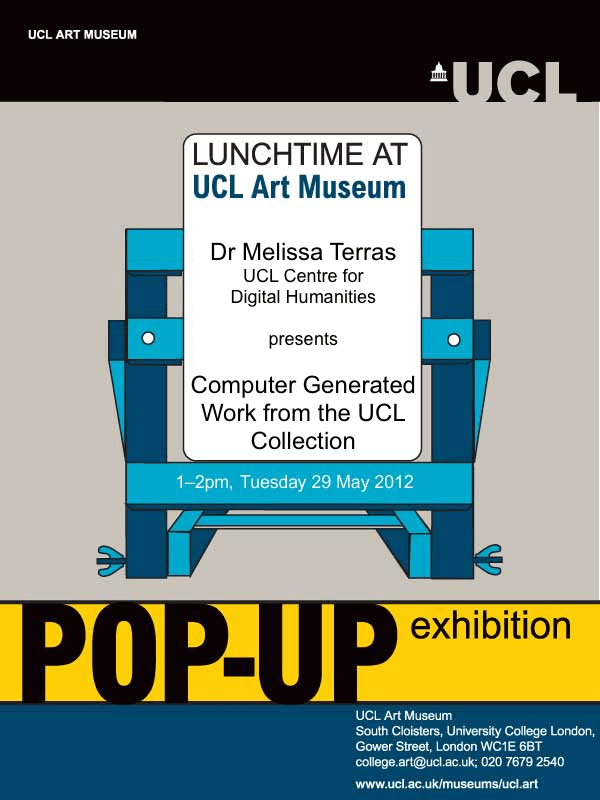
Today was my first day in UCL for 5 weeks, and I had a really enjoyable task to start the working day with: off to the UCL Art Museum to choose items in the archive, with the help of the curator, Andrea Fredericksen, for a pop-up exhibition I will be holding there in a few weeks time.
Pop-Up displays at UCL Art Museum are held throughout the year. By becoming a guest curator for one day, anyone at UCL can select works from the vast art collection. They can share their choices with students, colleagues and the general public in the informal setting of a free lunchtime exhibition in the museum. I am delighted to get the opportunity to do this! But what to choose?
UCL Art Museum. One of my choices is on the easel behind the painting, handily obscured by the glare to keep it a surprise.
Given my background in computing and the arts and humanities, I thought it would be really fun to try and see what computer generated art there was in the collection. UCL has a good history of this – there was a lot of experimental computer art going on with the aid of the engineering faculty in the 1970s, and the Slade School of Fine Art (part of UCL)
established what was later called the ‘Experimental and Computing Department’. The Slade was one of the few institutions that attempted to fully integrate the use of computers in art into its teaching curriculum during the 1970s. The department offered unparalleled resources with its in-house computer system. [see here for a picture of the Slade Computing System, halfway down the page]
The Slade Centre for Electronic Media in Fine Art has been running since 1995. What interesting art works that started their life on a computer now lurk in the UCL Art Museum archives?
Well, to find that out you’ll have to come by on Tuesday 29th May, 1-2pm! Free entry. See you there?
So, I admit, I committed a crime in social media circles. I created some content that I thought a few people may be interested in, posted it, then promptly went on leave for four weeks and didn’t follow up here. Sorry. Real life cant be helped though (we had to vacate our house for four weeks as it is being massively extended and I took the boys out of the way while walls came down and went up again. And when I got back the internet was broken in my shed).
I didn’t predict the level of interest that my post on blogging and tweeting about research papers would garner, though! It has been retweeted at least 500 times, featured in the Times Higher, been circulated to all the Deans and Heads of Department at UCL (so I’m told), been guest featured at the LSE Impact of Social Sciences blog, and been viewed by at least 7000 people (including the stats from LSE). I even have 200 or so new twitter followers (hullo!) So, further evidence that its worth keeping up this blogging malarky then…
Best get back to it. Need to think of something else as interesting to write next… but therein madness lies. I’ve enjoyed seeing how far a little, simple, idea of mine flew. Now on to the next thing…
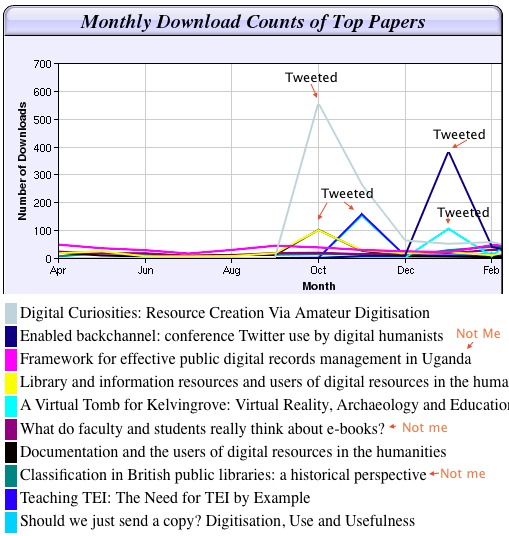
Guess when I tweeted my papers? Top ten downloaded papers from my department in the last year, 7 of which include me in the author list.
In October 2011 I began a project to make all of my 26 articles published in refereed journals available via UCL’s Open Access Repository – “Discovery“. I decided that as well as putting them in the institutional repository, I would write a blog post about each research project, and tweet the papers for download. Would this affect how much my research was read, known, discussed, distributed?
So what are my conclusions about this whole experiment?
Some rough stats, first of all. Most of my papers, before I blogged and tweeted them, had one to two downloads, even if they had been in the repository for months (or years, in some cases). Upon blogging and tweeting, within 24 hours, there were on average seventy downloads of my papers. Seventy. Now, this might not be internet meme status, but that’s a huge leap in interest. Most of the downloads followed the trajectory I described with the downloads to Digital Curiosities, in that there would be a peak of interest, then a long tail after. I believe that the first spike of interest from people clicking the link that flies by them on twitter (which was sometimes retweeted) is then replaced by a gradual trickle of visitors from postings on other blogs, and the fact that the very blog posts about the papers make them more findable when the subject is googled. People read the blog posts – I have about 2000 visitors here a month, 70% new, with an average time on the site of 1 minute and 5 seconds. You come here and tend to read what I have written (thanks!) and seem to be clicking and downloading my research papers.
The image above shows the top ten papers downloaded from my entire department over the last year. There were a total of 6172 downloads from our department (UCL Department of Information Studies is one of the leading iSchools in the UK). Look at the spikes. That’s where I blog and tweet about my research. I’m not the only person producing research in my department (I think there are 18 current members of staff and a further 20 or so who have moved on but still have items in the institutional repository, but I’m the only person who has gone the whole hog on promoting their research like this). You will see that 7 out of 10 of the most downloaded papers from my Department in the last calendar year have me in the author list. As a clue, I dont know anything about Uganda, e-books, or classification in public libraries. 27 out of the top 50 downloads in our department in the last calendar year feature me (as a rough guide, I get about 1/3 of the entire downloads for my department). My stuff isn’t better than my colleagues’ work. They’re all doing wonderful things! But I’m just the only one actively promoting access to my research papers. If you tell people about your research, they look at it. Your research will get looked at more than papers which are not promoted via social media.
Some obvious points and conclusions. Don’t tweet things at midnight, you’ll get half the click throughs you get through the day when people are online. Don’t tweet important things on a Friday, especially not late – people do take weekends and you can see a clear drop off in downloads when the weekend rolls around and your paper falls a bit flat, as you sent it on its way on social media at the wrong time. The best time is between 11am and 5pm GMT, Monday to Thursday in a working week. I have the stats here somewhere to prove it. I wont write it up, though, as its pretty predictable (you would think! But somehow the message doesn’t get through to people that just putting it on twitter isnt enough, you have to time it right. The Discovery twitter account regularly posts an automated list of the really interesting things people have been looking at… at 10pm on a Friday night. Sheesh. I only know as I’m regularly sad enough to still be on twitter at that time, but I suspect if they tweeted the papers through the day during the working week… well, you guess what would happen?)
The paper that really flew – Digital Curiosities – has now been downloaded over a thousand times in the past year. It was the 16th most downloaded paper from our entire institutional repository in the final quarter of 2011, and the 3rd most downloaded paper in UCL’s entire Arts Faculty in the past year. It’s all relative really – what does this really mean? Well, I can tell you that this paper was the most downloaded paper in 2011 in LLC Journal, where it was published (and where it lives behind a paywall apart from being available free from Discovery). LLC is the most prestigious journal in the discipline I operate in, Digital Humanities. The entire download count for this paper from LLC itself, which made it top paper last year? 376 full text downloads. There have been almost 3 times that number of downloads from our institutional repository. What does this mean? What can we extrapolate from this? I think its fair to say: It’s a really good thing to make your work open access. More people will read it than if it is behind a paywall. Even if it is the most downloaded paper from a journal in your field, Open Access makes it even more accessed.
I cant know if the downloaded papers are read though, can I? The only way to do so is to enter the murky world of citation analysis. The trouble with this is the proof of the pudding will come to light in a few years time – if someone reads something of mine now and decides to cite it, its going to take 1 or even 2 years – or more – for it to appear in my citation list. So, I’ll be keeping an eye on things, not too seriously as we all know things like H index are problematic. Just for the record, at time of writing, I have 218 citations, according to Google scholar. My H index is 8, and my i10 index is 5, which is ok for a relatively young Humanities scholar (I’m still technically an Early Career Researcher for another year, as defined by the UK funding councils). Digital Curiosities only has 3 published citations to date. 3 published citations. Remember, it’s been downloaded over 1300 times, between LLC and our repository. Will this citation count grow? Will I be able to demonstrate, over the next few years, that retweeting leads to citation? Will I be able to tell how people came across my research – if they come across my research? We’ll see. Dont worry, I’ll blog it if I have anything to say on this.
I also know nothing about how many times my other papers are downloaded from the websites of published journals, or consulted in print in the Library. The latter, no-one can really say about – but the former? It seems strange to me that we write articles (without being paid) and we get them published by people who make a profit on them, then we don’t even know – usually – how many downloads they are getting from the journals themselves. The only reason I know about the LLC statistics is because I am good friends with the Editor. So, there are obvious advantages to being able to monitor my own downloads from my institutional repository. Its been a surprise to me to see what papers of mine are of interest to others. (Should that drive my research direction, though?)
The final point to make is that people don’t just follow me or read my blog to download my research papers. This has only been part of what I do online – I have more than 2000 followers on twitter now and it has taken me over 3 years of regular engagement – hanging out and chatting, pointing to interesting stuff, repointing to interesting stuff, asking questions, answering questions, getting stroppy, sending supportive comments, etc – to build up an “audience” (I’d actually call a lot of you friends!) If all I was doing was pumping out links to my published stuff would you still be reading this? Would you have read this? Would you keep reading? My blog is similar: sure, I’ve talked about my research, but I also post a variety of other content, some silly, some serious, as part of my academic work. I suspect this little experiment only worked as I already had a “digital presence” whatever that may mean. Thanks for putting up with me. All these numbers, these stats. Those clicks were made by real people. Thanks!
So that would be my conclusion, really. If you want people to find and read your research, build up a digital presence in your discipline, and use it to promote your work when you have something interesting to share. It’s pretty darn obvious, really:
If (social media interaction is often) then (Open access + social media = increased downloads).
What next? From now on, I will definitely post anything I publish straight into our institutional repository, and blog and tweet it straight away. After all, the time it takes to undertake research, and write research papers, and see them through to publication is large: the time is takes to blog or tweet about them is negligible. This has been a retrospective journey for me, through my past research, at a time when I came back from a period of leave. It’s been fun to get my act together like this – in general I needed to sort out my online systems at UCL, so it gave me some impetus to do so. But it has shown me that making your research available puts it out there – and as soon as I have something new to show you, you’ll be the first to know.
And here are a list of my personal top downloaded items from our repository, with download count since October, when I started this. Just for your eyes only, you understand.
A. They dont exist. For the past couple of weeks I’ve noted down the “name” of the spam bots messaging me on twitter. Goodness, spam bots are irritating, yes. But look at these names – aren’t they fabulous?
I often have a gentle chuckle to myself at some of the random combinations that are generated by our bot chums. Vaksman Innes, Hoaglin Little, Marylou Freas – surely the names of previously anonymous guests from one of Jay Gatsby’s parties? Tanisha Hendricks, Lee Buffet, Tish Dreith – straight from a Jilly Cooper novel? Tia Printz, Cryssie Amberd, Runels Stewart – straight from whatever the cool high school tv series du jour is? And poor old Greg Jeffries, tagging along beside all his more glamorous friends…
What is it about the randomly generated names that make them seem so fascinating, so charismatic? The combination of strings of known characters wont take into account any of our tacit understanding of the cultural norms of naming, nor its traditional sounds, beats, or cadences. It makes them seem other wordly, known but ridiculous, celebrity like. Which means perhaps we will pay them more attention? The names are delibrately set to be at the rare and obscure end of the naming bell curve?
An article from a good few years ago in the New York Times – before Twitter was even imagined – summed up the automatic name generation tools used by spammers – suggesting that online tools such as the Random Name Generator (based on data from the US Census to randomly generate names, with even a setting provided for how obscure you want them to be) are routinely used to generate these never-were spammers.
I’m as irritated as the next person by spam. What a waste of our resources. But in some alternative universe, my people-named-after-spam-bots are dancing late into the night, Vaksman with Marylou, Tanisha with Lee, the growing spam roll-call being the mother of all social-media party invites spiraling out of control.
Something very exciting happened last week over at Transcribe Bentham, the crowdsourcing transcription project at UCL that I am part of. Buried within the weekly blog post giving an update on the transcription process was an announcement. It was easy to overlook it – given the stats that are now rolling out from TB:
3,057 manuscripts have now been worked on, up 82 on last week’s total; this is the biggest seven-day increase since the week ending 4 January 2011. The 3,000-transcript mark has now been comfortably broken, and congratulations to volunteer Diane Folan for transcribing her 1,000th manuscript, and volunteer JFoxe for having transcribed her 500th manuscript in little over six months. Volunteer Lea Stern isn’t far off the 500-transcript mark either.
In total, we’re now over 1,500,000 words of transcription done by volunteer labour over the last 18 months or so. Them’s a lot of transcription, and we’re really delighted with the pace that is picking up. But no, that’s not what I mean to talk about just now. The truly exciting thing is this:
That’s right. The code we made is now in use by another institution, to do their own transcription project. Hurrah!
It was always our aim in Transcribe Bentham to provide the code to others: it was a key part of our project proposal. But you always have to wonder if that is going to happen. Its the kind of thing that everyone writes in project proposals. And whilst lots of people talk about making things in Digital Humanities, and whether or not you have to make things to be a Digital Humanist, we’ve shied away – as a community – from the spectre of reuse: who takes our code and reappropriates it once we are done? How can we demonstrate impact through the things we’ve built being utilised beyond just us and – quite frankly – our mates?
So I’m happy as larry that the code we developed, and the system we have built, is both useful to us, but is now useful to others. I’m not sure how much I want to prod the sleeping monster that is general code reuse in Digital Humanities… dont draw attention to our deficiencies!
But I would be delighted if anyone else could point me to examples where code and systems in Digital Humanities were repurposed beyond their original project, just as we would wish?